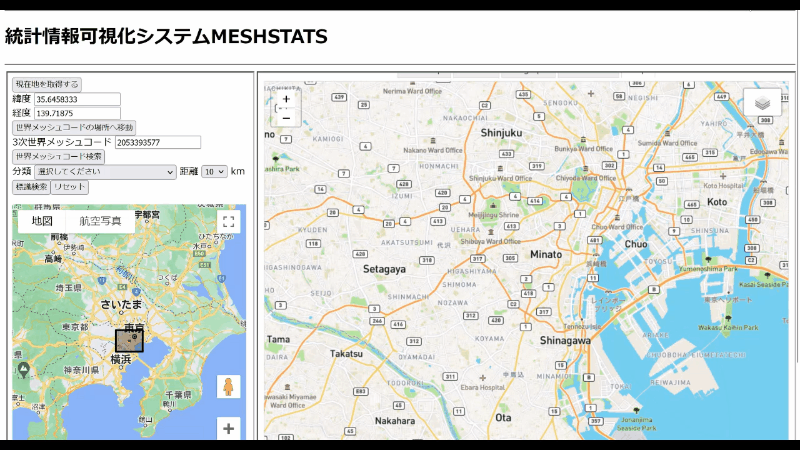
Click on [World Mesh Code Search], then extract the basic mesh statistics for the current selection.
You can select the area from 2 km to 35 km.
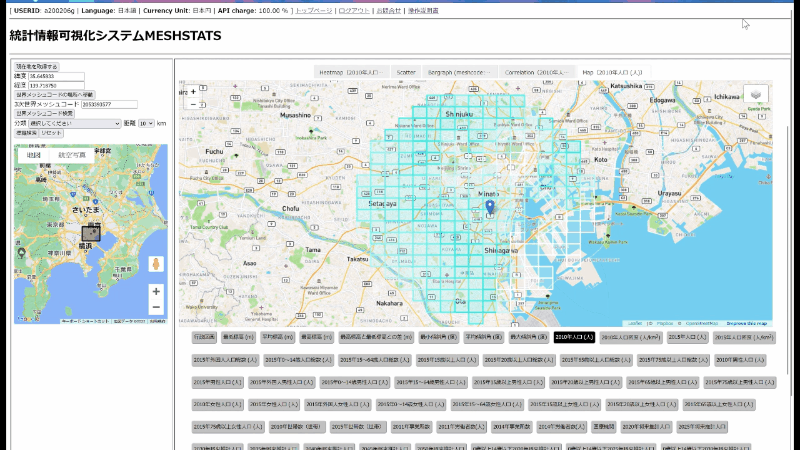
When you go to the data acquisition screen, you will see a screen shown below. In the upper part of the data acquisition screen, there are links to return to the top page, bookmark, contact, and this operation manual. At the toppest, USERID: Registered User ID, Language: Current Language Settings, and Currency Unit: Current Currency appear. A map is shown in the left sub-panel. The map type can be selected in change user information. The selected rectangular region on the map is displayed by different color. You can see latitude and longitude (world mesh code), and the initial size of the rectangular region is set as 600 arcseconds in latitude × 900 arcseconds in longitude. The size of the rectangular region is adjusted from 120 arc seconds in latitude x 180 arcseconds in longitude to 2100 arc seconds in latitude × 3150 arcseconds in longitude.
If you click on [Get your current location], you will see permission confirmation to send your location information.If allowed, it will move to an area centered on your current location.
if you click on [Search world meshcode] in both Google Maps and ESRI maps, then the data in the currently selected region begins to be retrieved from the database. The retrieved data and the software for data analysis are displayed in the panel of the right-hand side.
In Google Map, You can retrieve data around a selected landmark besides [Search world mesh code]. Select an area on the map, choose a type of landmark in categories, and click [Search objects], then the data starts to be retrieved.
The following types of landmarks are available currently:
Clothing Store, Boutique, Bakery, Liquor Store Fe, Cinema, Internet Cafe, Massage, Supermarket, Convenience Store, Pharmacy, Confectionery Store, Post Office, Bank, ATM, Barber Shop, Hotel, Simple Accommodation, Minshuku, Art Museum, Hot Spring Bath, Park, Taxi Stand, Hospital, Toyle, stone monument, world heritage, special victory, station name, bus stop, school, kindergarten/ daycare center, university, Parking, Police Station, Police Box, Postbox, Public Telephone, Apartments and Mansho, dormitories, city hall, community center, Christian church, Buddhist temple, shrine, Islamic temple, Synagogue, Zoroastrian Temple, Ski Route Station, and Gas Station.If you click a landmark, then a clickable link in a pop-up window is displayed. If you click a landmark, then a clickable link in a pop-up window is displayed. if you click a clickable link, then data retrieving around the selected landmark starts.

Click on [World Mesh Code Search], then extract the basic mesh statistics for the current selection.
You can select the area from 2 km to 35 km.
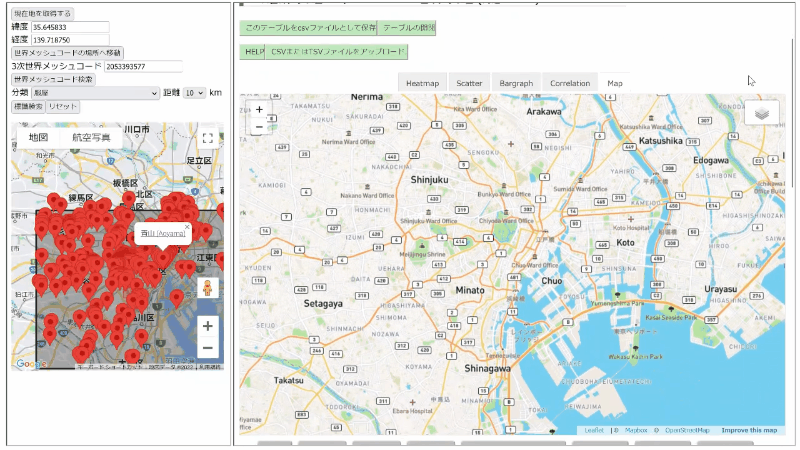
You can save, display, and add World mesh data.
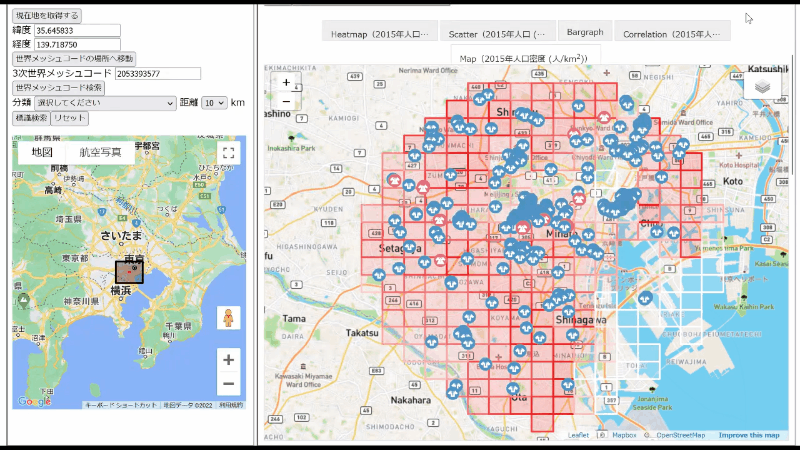
When using the map function, if you click on the gray box on the upper right side of the map of the right-hand side, then you can plot selected landmarks as different icons on the map of the right-hand side. You can partially calculate the values of some world mesh statistics and data around a selected landmark. You can further calculate the number of identical landmarks that exist in the selection area. This function can be used to measure the surrounding environment and to estimate competitors in simple demand forecasting.

If you click on buttons, then World Mesh Data are displayed.