In addition to the basic function, there are 32 functions in MESHSTATS. Current available functions are:
basic grids
mesh statistics based on government statistics and open data are available
tsunami hazard grids
in addition to the basic mesh tsunami hazard You can use the mesh
seismic hazard grids
the National Institute of Disaster Prevention You can take advantage of the earthquake hazard mesh provided by JSHIS
inundation height grids in flood assumed areas
You can use in addition to basic mesh statistics, land transportation using mesh statistics derived from the state-saving national land numerical information flood edited polygon data
biomass forest growth grid
Image-derived National Mapping Organization (GLCNMO) 2013 Global Land Cover 15 arcseconds (500m) data (version 3) (c)GLCNM
job advertisement grids
A job ad mesh by industry, created from automatically collected daily job ad data.
job advertisement time-series
Displays in chronological order the number of job ads by industry, calculated from automatically generated daily job ad mesh statistics
hotel search
automatically collected daily accommodation plan data available accommodations around the selection area, which is created as a source data, View the future value of the number of accommodation plans
hotels statistics
Displays the daily room occupancy rate (estimated) in the selection area up to one week, generated from accommodation plan data that are automatically collected every day.
monthly accommodation statistics grids
Displays monthly room occupancy rate (estimated) in the selection area , generated from accommodation plan data that are automatically collected every day that is created as the source data.
daily accommodation statistics grids
Displays the daily room occupancy rate (estimated) in the selection area up to one week, generated from accommodation plan data that are automatically collected every day.
daily accommodation mean rate grids
automatically collected daily accommodation plan days daily average price time series in the selection area that is created as the source data
daily accommodation sales grids
automatically collected daily accommodation plans Daily sales estimation time series in the selection area where data is created as source data
Ministry of Land, Infrastructure, Transport and Tourism Accommodation Travel Statistics
Ministry of Land, Infrastructure, Transport and Tourism accommodation travel statistics calculated from survey mesh statistics is displayed as a statistical table.
Ministry of Land, Infrastructure, Transport and Tourism domestic accommodation statistics grids
Ministry of Land, Infrastructure, Transport and Tourism The number of Japanese guests calculated from the survey mesh statistics is displayed as a statistical table.
Ministry of Land, Infrastructure, Transport and Tourism foreigner accommodation statistics grids
Ministry of Land, Infrastructure, Transport and Tourism The number of foreign guests calculated from the survey mesh statistics is displayed as a statistical table.
tourism resource information
Displays the tourism resources of the region in the city classification you want to use.
monthly accommodation statistics per municipality
Displays the room occupancy rate (estimated) by municipal unit generated from accommodation plan data that are automatically collected every day.
aggregation per municipality
Displays various mesh statistics provided as public statistics by municipal unit.
railway passengers statistics
Displays passenger statistics for train stations
JTA job advertisement statistics around railway station
Recount and display the number of job ads statistics for train station or rail line.
JTA accommodation statistics around railway station
Recount and display accommodation plan data statistics for train station or rail line.
Search Nearby Ports by OpenStreetMap
Displays world mesh statistics available around selected ports.
international flights
Displays the capacity of departure and arrival international passenger and air transport calculated from airline timetable
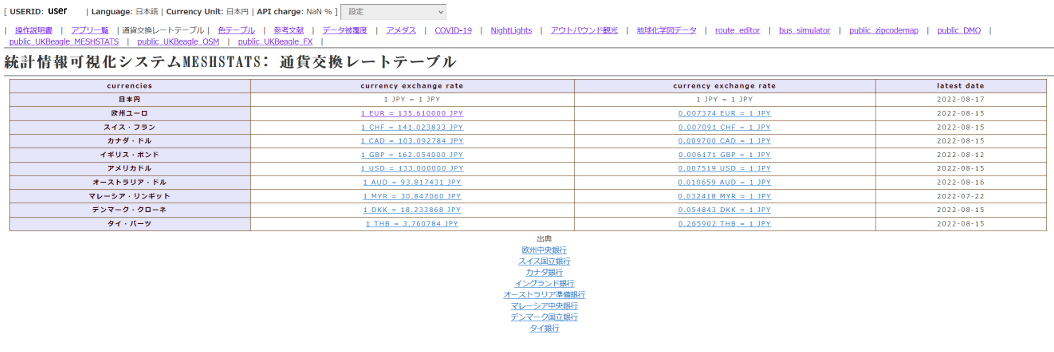
Currency Exchange Rate Table
Explanation
The exchange rate table displays the latest exchange rate published by central banks. Currency unit you selected is used as the base currency of the exchange rate table. The displayed exchange rates are median rates between bid and offer exchange rates. By clicking on the clickable exchange rate, you can access historical exchange rates as the time series data.
Data source
The exchange rates displayed in the exchange rate table are acquired from the following central banks: European Central Bank, Swiss National Bank, Bank of Canada, Bank of England, Reserve Bank of Australia, Central Bank of Malaysia, National Bank of Denmark, and Bank of Thailand.
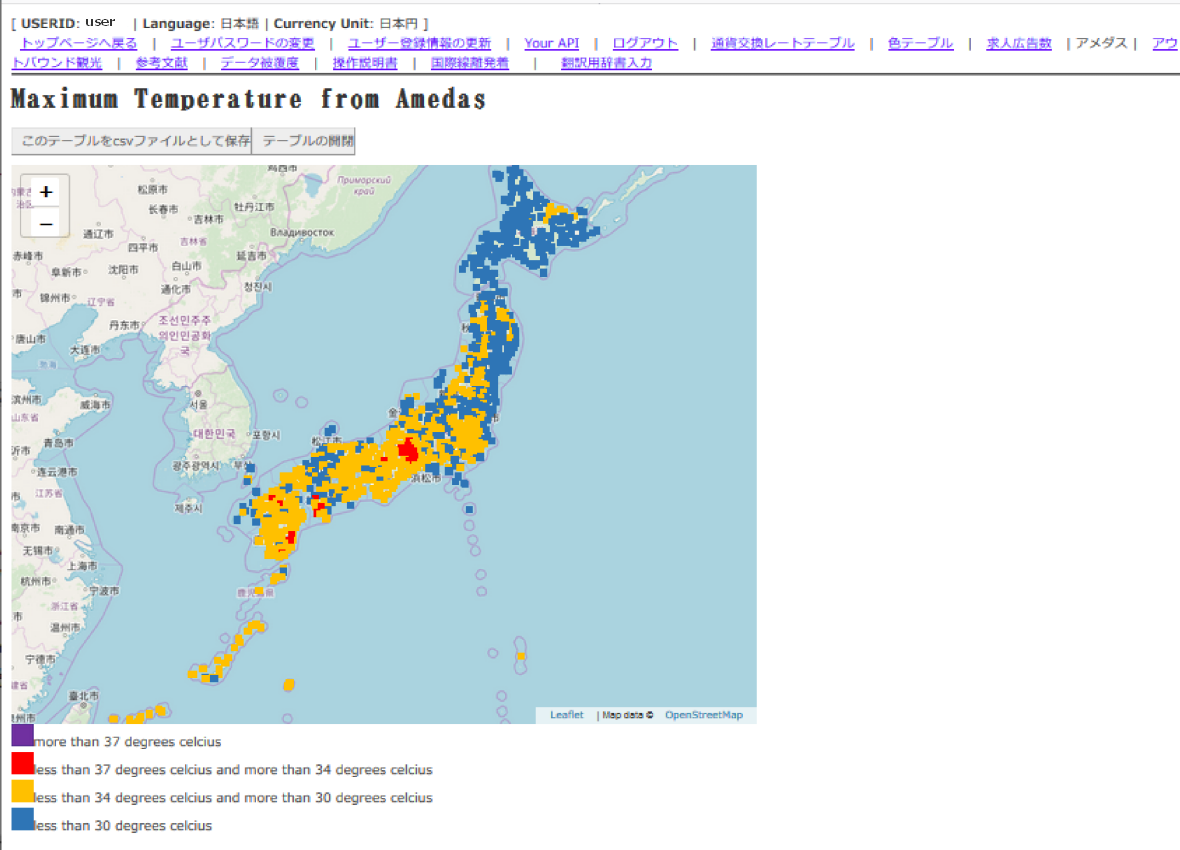
AMeDAS
Explanation
This page shows place names, maximum temperatures, and world grid square code at each observation point to be announced by the Japan Meteorological Agency.
If you click [Download the table as a csv file], data can be retrieved as a CSV file. In addition, If you click on [open and close the table] button, a table of registered major cities is directly displayed.
How to use
If you click on the square that represents each major city, the highest temperature, elevation will be shown in a pop-up window. If you click the clickable city name in the pop-up window, you can open the data retrieval screen centered on that location.
Data Coverage
Explanation
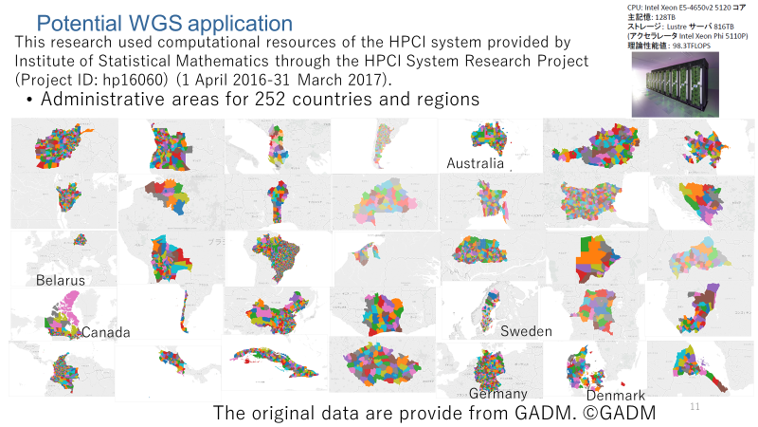
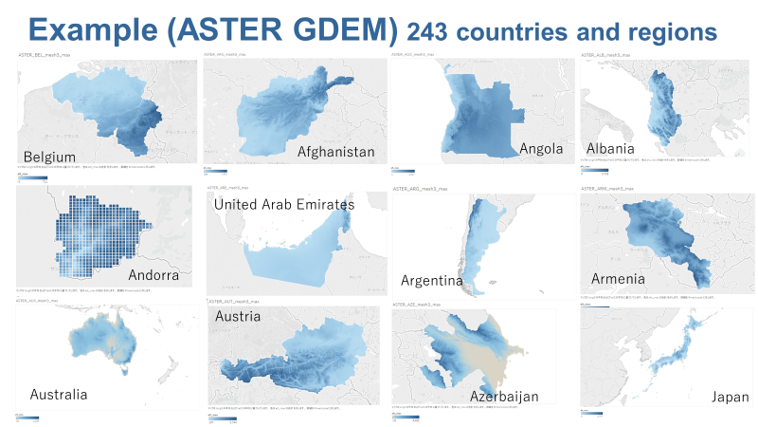
MESHSTATS can currently provide four types of basic world grid square statistics and data such as 2015 GADM administrative area, Land Usage: National 2013 Global LandCover 15 sec. angle (500m) by Mapping Organization (GLCNMO) (version 3) (c)GLCNMO, elevation: (c) METI ASTER global numerical elevation model (GDEM) third-level world grid square statistics created from (30m x 30m), night-time light intensity: 2012 NASA Night-Time Light Intensity 24-Second Angular Image Data (c) NASA, and Tsunami Hazard: Estimation from past 1000-year NOAA tsunami run-up data and JAXA digital surface model constructed by ALOS (Daichi) World 3D. The data coverage displays a list of country and the number of thrid-level world grid square statistcs available in MESHSTATS. The list includes country code (ISO3166), country or region name, major city name, and the available number of third-level world grid square statistics in each basic dataset.
How to use
A clickable link for main cities is provided with their goegraphic location. If you click it, then the data acquisition screen at a centered location of the selected city will be displayed .
Other Apps
Explanation
On MESHSTATS, we are developing new applications one after another. For information on how to operate applications not listed in the manual, please refer to the instructions located in each application. The number and types of applications available depend on the status of the member. To enable the features, please contact the system administrator through the "Inquiry" page.
COVID-19
Displays a Covid19 chart with prefecture names, actual and forecast values at each observation point at the moment. Click on the blue prefecture name link to obtain a CSV file of covid-19 data for the observation location.
NightLights
World mesh codes, 2015 population, and nighttime light intensity (average) can be displayed. These data are for each observation point at the current time as published by MESHSTATS. If you click [Download the table as a csv file], data can be retrieved as a CSV file.
Outbound tourism
Displays the name of the city and hotel number at each location. Click on the blue balloon representing each major city, and the city name and hotel number will pop up. If you click the clickable city name in the pop-up window, you can open the data retrieval screen centered on that location.
Geochemical map data
If you select the chemical equation enclosed in a square, the place name and world mesh code at each observation point at the moment are displayed. The chemical formula is published by AIST and the displayed data is published by the JMA. If you click on the square placed at the location where the substance is located, the place name, world mesh code, and the amount of the specified substance will pop up on the screen. Click on the link on the pop-up window, then the data acquisition screen is displayed.
public_zipcodemap
Displays a Covid19 chart with prefecture names, actual and forecast values at each observation point at the moment. Click on the blue prefecture name link to obtain a CSV file of covid-19 data for the observation location.
public_DMO
Displays a Covid19 chart with prefecture names, actual and forecast values at each observation point at the moment. Click on the blue prefecture name link to obtain a CSV file of covid-19 data for the observation location.
public_UKBeagle_MESHSTATS
Displays a Covid19 chart with prefecture names, actual and forecast values at each observation point at the moment. Click on the blue prefecture name link to obtain a CSV file of covid-19 data for the observation location.
public_UKBeagle_OSM
Displays a Covid19 chart with prefecture names, actual and forecast values at each observation point at the moment. Click on the blue prefecture name link to obtain a CSV file of covid-19 data for the observation location.
public_UKBeagle_FX
Displays a Covid19 chart with prefecture names, actual and forecast values at each observation point at the moment. Click on the blue prefecture name link to obtain a CSV file of covid-19 data for the observation location.